
① Function ID master
The scope spine
Anything not on the master isn't tracked. Keep it wherever you already maintain your function/feature catalogue.


 CSV
+ LV3 template
CSV
+ LV3 template
A single-file dashboard for managers and executives. Drop in master, WBS, defects, test counts, code lines — the dashboard joins them on Function ID and surfaces the truth: what's late, what's failing, who's where, what's at risk. Every byte stays on your machine.
Validate by jumping
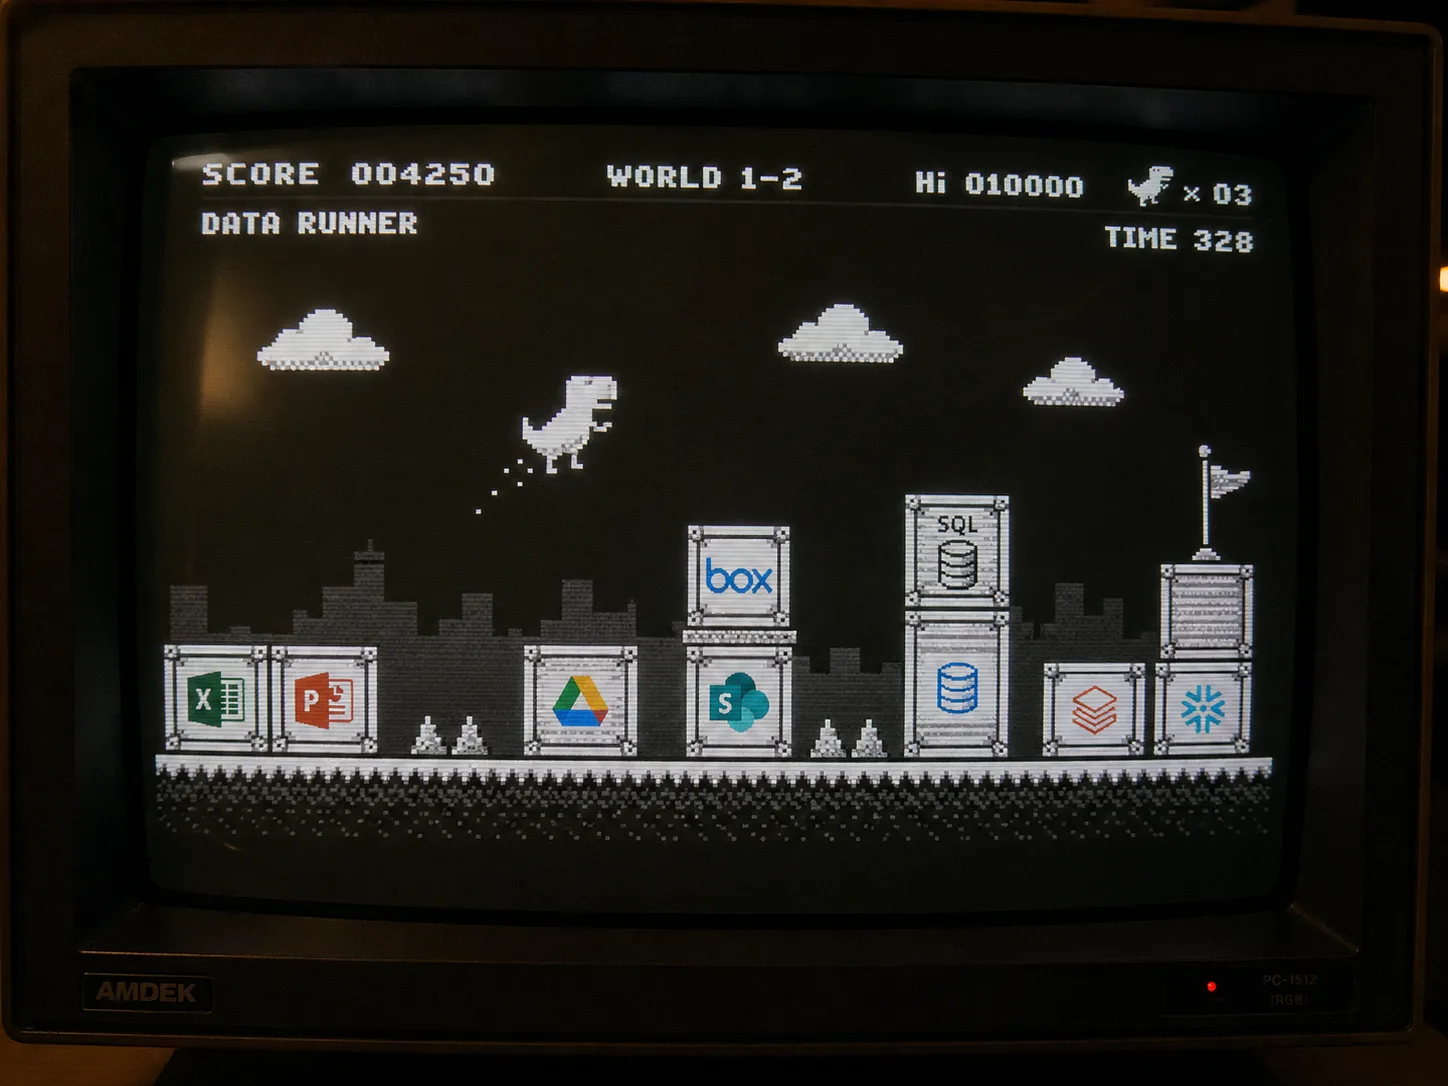
Every upload runs a 7-step validation. The dashboard shows you the steps as cacti the raptor jumps. On all-clear, it reaches the goal. On the first hard error, it slams into the bad cactus and a hurt stegosaurus pops up to explain what failed. No spinner. No silent failure. No log-diving.
The TREX is the system's brand logo; the hurt stegosaurus shown on error belongs to the same pixel-art set.
First view
When the dashboard finishes loading, three cards greet the manager: the worst-risk function, the people on it, and the delivery pulse. Everything else is one click away.
Risk score 0.84 · 終了予定 5 days overdue · 障害発生率 above threshold
Role progress: dev 100% / test 30% — bottleneck on test execution
Variation tightening; CFR 12% (band: Good)
Explore the console
This is the current dashboard in miniature. Move the mouse across it — the nearest widget lights up and the panel on the right explains what it does, newest capabilities included. Nothing here is a real project; every figure is illustrative.
Dashboard for DX — 機能ID: all in scope
Inputs · Charts · Calendar · 🚨 Alerts · 🏁 Delivery
EN / 日本語
Miniature of the current build. Function IDs and figures are illustrative, not a real project.
Bring your existing tools
Excel, Redmine, JIRA, Airtable, Backlog, GitHub Issues, ServiceNow, plain CSV — the dashboard reads them all. Each slot is an import endpoint matched to the standard format of a major tool (Redmine / Backlog, etc.); LV3 supplies an adapter for any other format. If your team isn't already producing one of the seven artifacts, LV3 ships a starter template you can hand off to your PM. Zero new tools to adopt. Zero new formats to learn.
Anything not on the master isn't tracked. Keep it wherever you already maintain your function/feature catalogue.
CSV
+ LV3 template
The richest artifact: planned/actual periods, effort, sub-task rows with role keywords driving 担当者×ロール analytics.
 MS Project export
Asana export
+ LV3 template
MS Project export
Asana export
+ LV3 template
Filtered to the defect-class tracker (e.g., 不具合管理 in Redmine). Encoding auto-detected (UTF-8 / CP932 / ASCII).


 Backlog
ServiceNow
+ LV3 template
Backlog
ServiceNow
+ LV3 template
Per Function ID: 総テスト, 実施済, OK, NG. Drives test-density alerts and quality scoring.
 Zephyr (Jira)
CSV
+ LV3 template
Zephyr (Jira)
CSV
+ LV3 template
Lines of code per Function ID. Trend across snapshots feeds the LoC-trend chart and the LoC × NG scatter.
 cloc output
Coverity
CSV
+ LV3 template
cloc output
Coverity
CSV
+ LV3 template
Page count per Function ID. Filled in directly in the dashboard — no upload needed. Auto-saves to design_pages.json.
行事 (global events) and 個人非稼働日 (per-assignee non-working days) layers for the Gantt and the calendar.

 iCal / .ics
+ LV3 template
iCal / .ics
+ LV3 template
If your team uses a tool we haven't listed — internal in-house issue tracker, custom REST API, exotic export format — LV3 writes the import adapter. Same Function ID, same dashboard.
What you see
No new authoring environment. The dashboard renders interactive charts and a navigable calendar from the seven artifacts you already produce. Sample data shown below — fully synthetic, but matches the real shape: AUTH001 (User Login) / AUTH002 (User Registration) / SEARCH01 / CART001 / NOTIFY01 / ORD001. Every chart is one click away from an A3-landscape PDF (auto-grown page height).
Sample data shown — fully synthetic, fictional Function IDs. Real-world data shape is identical.
Drilldown
Schedule, assignees, role progress, sub-tasks, tests, code, defects, scores, trend across snapshots. One view. PDF-exportable.
主要ストリーム: 開発 田中 → テスト仕様書 鈴木 → テスト実施 渡辺. ⏰ 終了予定まで 5 days overdue (5/15 → 5/20 →…).
⚠ Bottleneck: dev done, test execution barely started.
DORA 5Keys · Trailing 30 days
Lead time, change-failure rate, mean-time-to-recovery, reliability — colour-coded against the DORA 2024 industry bands (Good / Normal / Bad). Hover any card for the metric definition, source column, and exact thresholds.
🚨 Alerts
Every Function ID gets a single score on a 0–1 scale. The score combines defect rate, schedule delay, test density, and test-execution rate — weighted by impact. Crossing a threshold tier raises an alert tile.
PMBOK coverage
Dashboard for DX is not a project-management toy. It maps directly onto PMBOK's ten knowledge areas — most fully, two partially, one explicitly out of scope. Deliberate trade-offs, all documented.
Fully covered — Integration, Scope, Schedule, Quality, Resource, Communications, Risk. Partial — Cost (effort tracked but not direct cost), Stakeholder (drilldown for managers + DORA for execs, no formal stakeholder map). Out of scope — Procurement (your contracts and POs live in your finance system).
Five artifacts joined on one Function ID key. Integration is what we are.
Function ID master is the scope spine. Anything not on the master sheet isn't tracked. Scope creep becomes visible immediately.
WBS planned vs actual, Gantt, calendar layers, today marker, auto-flag overruns and delays.
Effort tracked (planned vs actual person-days) — the labour-cost component. Direct cost layer is up to your finance system.
Tests planned vs executed, pass/fail rate, density per Function ID, threshold-breach alerts.
Assignees from WBS, role × person analytics, role-progress mini-bars, bottleneck surfaces, roster.
A3-landscape PDFs, drilldown PDFs, per-section reports — every view one click from a regulator-grade share.
0 – 1 risk score, weighted formula, severity tiers (HIGH / MEDIUM / LOW). Alert tiles surface what to fix first.
Out of scope. Contracts, POs, and vendor management live in your finance / ERP system. We don't try to replicate that.
Managers get the drilldown. Execs get DORA 5Keys. Not a formal stakeholder map — but the right view per audience.
Privacy is the headline
Your project artifacts are sensitive — defect logs, internal staffing, schedule reality. They don't belong in a SaaS dashboard. Dashboard for DX is a single self-contained app with no outbound network calls. Deploy it on the machine of your choice; that's the only place your data ever touches.
A single self-contained desktop app — your files, settings, and logs all stay on the same machine. The Charts tab can write A3-landscape PDF reports for sharing, but only when you ask.
LV3 handles installation, source-card configuration, alert thresholds, and team rollout. Your artifacts, our dashboard, no SaaS in between.